import poscidyn
import numpy as np
# Function that estimates force to activate nonlinearity
def F_max(eta, omega_0, Q, b):
return np.sqrt(
4 * omega_0**6 / (3 * b * Q**2)
* (eta + 1 / (2 * Q**2))
* (1 + eta + 1 / (4 * Q**2))
)
# Define system parameters
Q, omega_0, a, b = np.array([50.0]), np.array([1.0]), np.zeros((1, 1, 1)), np.zeros((1, 1, 1, 1))
b[0,0,0,0] = 1.0
modal_forces = np.array([1.0])
modal_contributions = np.array([1.0])
# Define sweep parameters
driving_frequency = np.linspace(0.75, 1.25, 256)
driving_amplitude = np.linspace(0.1, 1.0, 8) * F_max(0.2, omega_0[0], Q[0], b[0,0,0,0])
# Define classes
model = poscidyn.NonlinearOscillator(Q=Q, a=a, b=b, omega_0=omega_0)
excitation = poscidyn.OneToneExcitation(driving_frequency, driving_amplitude, modal_forces)
multistarter = poscidyn.LinearResponseMultistart(n_init_cond=32)
solver = poscidyn.TimeIntegrationSolver(max_steps=4096 * 8, n_time_steps=100, rtol=1e-4, atol=1e-7)
response_measure = poscidyn.Demodulation(multiples=(1,), modal_contributions=modal_contributions)
# Run the sweep
frequency_sweep = poscidyn.frequency_sweep(
model = model, excitation=excitation, solver=solver,
response_measure=response_measure, multistarter=multistarter
)
# Plotting
import matplotlib.pyplot as plt
forward = np.asarray(frequency_sweep.modal_superposition.amplitudes["forward"])
backward = np.asarray(frequency_sweep.modal_superposition.amplitudes["backward"])
colors = plt.cm.viridis(np.linspace(0.15, 0.85, len(driving_amplitude)))
fig, ax = plt.subplots(figsize=(9, 5.5))
for amp_idx, (drive_amp, color) in enumerate(zip(driving_amplitude, colors)):
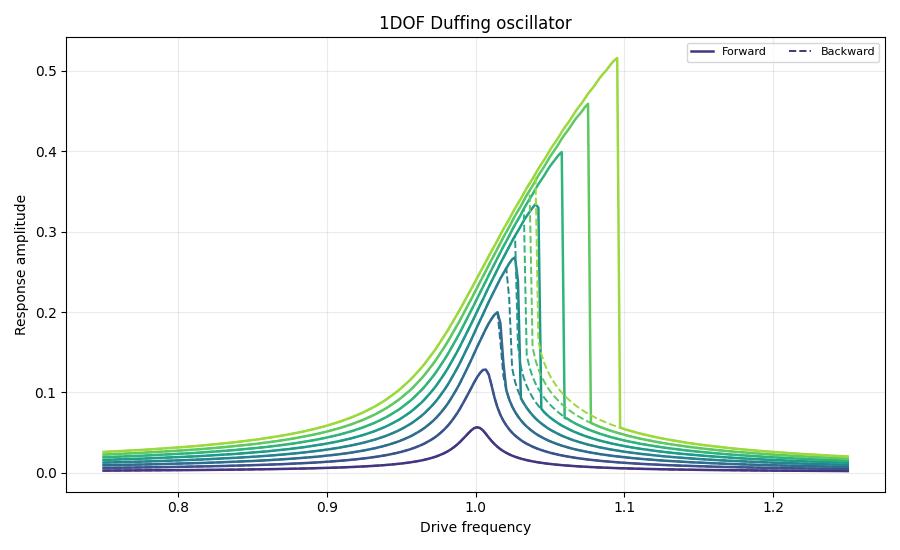
label_forward = "Forward" if amp_idx == 0 else None
label_backward = "Backward" if amp_idx == 0 else None
ax.plot(
driving_frequency,
forward[:, amp_idx],
color=color,
linewidth=1.8,
label=label_forward,
)
ax.plot(
driving_frequency,
backward[:, amp_idx],
color=color,
linestyle="--",
linewidth=1.4,
label=label_backward,
)
ax.set_title("1DOF Duffing oscillator")
ax.set_xlabel("Drive frequency")
ax.set_ylabel("Response amplitude")
ax.grid(alpha=0.25)
ax.legend(fontsize=8, ncol=2)
fig.tight_layout()
plt.show()